
Measure your meeting engagement with Slido Analytics

Understand how successful your
meetings are and easily share the results
further with your team.

Woman checking a Q&A engagement results with Slido.
Engagement iconEngagement score

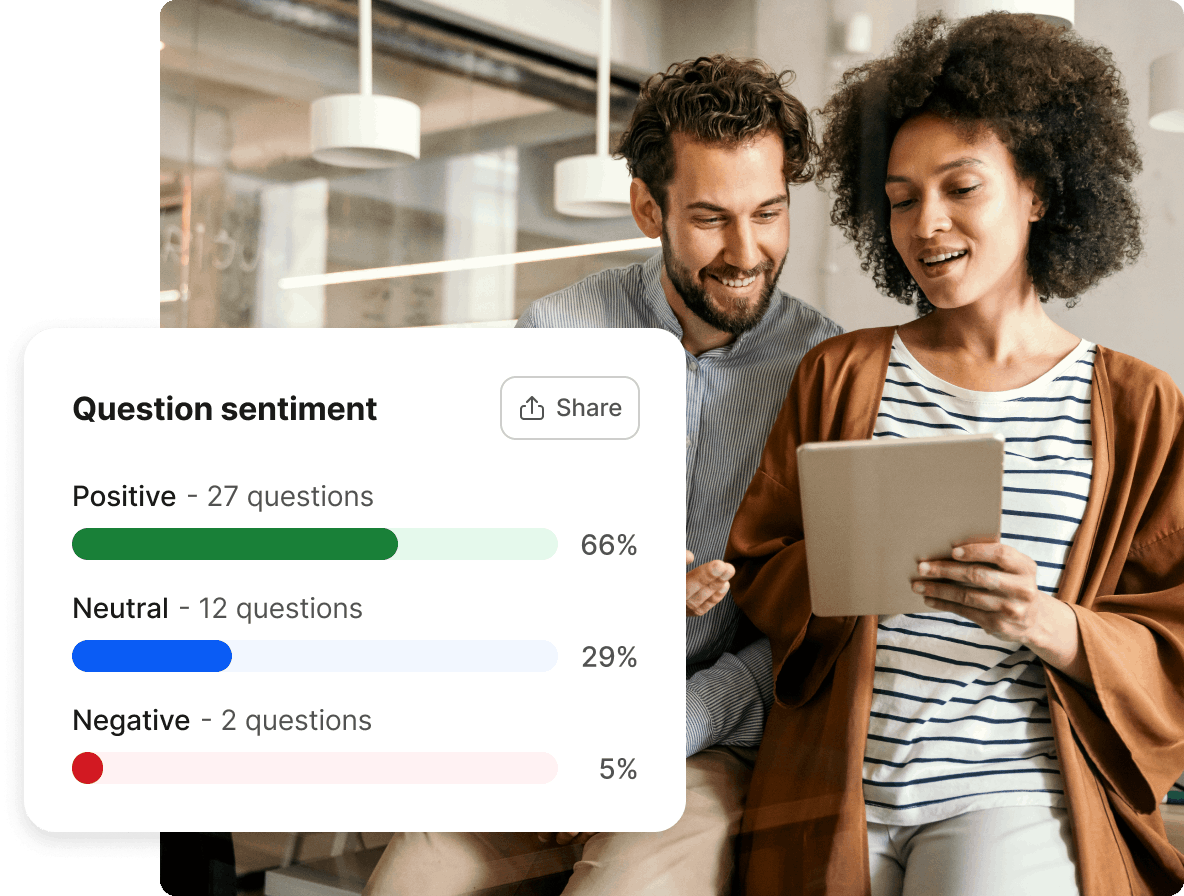
See how many people were engaged in your Q&A and polls

With the meeting engagement scores, you can quickly see how your participants interacted during your meeting. This allows you to compare your stats over time and improve from one meeting to the next.
Engagement score table.
Q&A iconQ&A sentiment

Discover the sentiment behind your Q&A

Was the overall mood of your Q&A positive, negative or neutral? Let our AI model automatically detect sentiment of the questions and adjust it where you disagree.


Learn more
Q&A sentiment table.
Sharing iconQuick sharing

Easily share your poll results as images

Download your beautiful word clouds or key results as images or simply copy them to clipboard for quick sharing.
Sharing word cloud as image.
Data report iconData report

Share the insights in a customizable data report

Choose which insights you want to share and generate a custom report to share with your team or participants.
Share event analytics.

Advanced features

Export results

Download more granular data to Google Sheets, Excel or PDF files.

Account analytics

Track and compare the meeting engagement of all meetings under your account.

Multiple rooms

See detailed analytics by individual rooms or tracks of your event.